Star Theorem
Acute Triangles in the Sky
June 21, 2022
By the end of this post, I hope you’ll agree with the following statement:
"There is a zero probability that three randomly placed stars in the sky create an acute triangle."
This claim has been labeled by my friends as Jeff’s Star Theorem. I’ve never been on board with calling it a theorem, I’d personally say something along the lines of the acute triangle conjecture. For those unfamiliar, an acute triangle is a triangle whose angles are all strictly less than \(90^{\circ}\).
Most people after hearing this statement feel comfortable disagreeing, if not with a mathematical argument then with the fact that, one can look up at the night sky and pick out many groups of three stars that create acute triangles.
In fact, that’s exactly where this idea originated. I distinctly remember the summer following my Junior year of high school, taking a weekend trip with some friends to a lake near where we live. One night some of us decided to go down to the beach and watch the night sky and, amidst laughter and late-night conversation between my friends around me and music playing that I had mentally tuned out, I found myself creating these triangles between triplets of stars found in that night sky. Playing around in my mind with the consequence of moving these triangle’s vertices around in the continuous plane of reference that I had, led me to that above realization - that to randomly choose three vertices of a triangle in the night sky means this triangle has a zero probability - a zero percent chance - of being an acute triangle.
That’s a fun thought - that somewhere out there in the cosmos lie three individual stars that first sparked this interesting realization of mine.
Possible with Probability Zero
You may notice that I keep saying that this event has a zero probability of occurring, and there’s a specific reason for this. I use these words because this event is not impossible, and there’s a subtle difference in this case between the meaning of those words that comes inherent to the continuous nature of placing stars among the night sky. That’s what we’ll explore here.
This is the very first problem most people have with our claim, is that it’s clearly possible to create an acute triangle with stars in the sky, and I’ll never argue with that. There are lots of examples of this in the sky that you could point out this evening. In fact, there are infinitely many ways to make an acute triangle by placing stars in the sky, yet the probability of this happening by chance remains zero. Sit tight, there’s more on comparable infinities in a bit.
Throughout the entirety of this post, when we say “random,” we are talking about “random according to a uniform distribution of outcomes.” This means that for any two possible outcomes of an event, both will be equally likely to occur from the random selection process (all outcomes are equally likely).
I have a very simple way of describing how events that are possible can still have probability zero of occurrance. If I asked you to find the probability that a random number chosen from from integers 0 to 9 (inclusive) is 5, you would easily give me the answer 0.1 (10%). You found this answer by using a formula that we all know, whether we realize it or not:
Probability of Success = Amount of Successful Outcomes / Total Number of Outcomes
In this instance, our selection set was formed from a discrete set of values - the integers from 0 to 9 - which made this above calculation trivial. One outcome where the chosen number is 5 with 10 total possible outcomes implies that the probability of randomly selecting a 5 is 0.1.
Now let’s change the rules a little bit. What if I instead asked you to find the probability that a random number chosen from real numbers 0 to 9 is 5? Clearly the number 5 is included in this set as a possible outcome, but so is 5.01, 5.00001, and 4.9999999… and each of the infinitely many numbers in between, meaning the Total Number of Outcomes in this instance is infinity. So this outcome is not impossible, yet absurdly unlikely. Probability zero unlikely.
In the same way, we can say that the probability of choosing any number except 5 randomly from this set has probability 1, but not certain.
There’s a small but important difference between these two questions, and I hinted at it before. In the first example, we were choosing from what we call a discrete set of values, meaning there are distinct values in the set such that each value is “isolated” from the rest. In the second example we have what we call a continuous set, as each element is no longer isolated from the elements surrounding it*. I like to think of a discrete set as a set that can be listed. The set of integers is discrete because you can write down the numbers in the set, starting with 0 and counting up, and also listing the negative numbers. You’ll never be able to write them all, but there is clear distinction (isolation) between each element in the list. In the second example, to list the numbers you would start out at 0, and then be left searching for the “next value” to write down out of our set of real numbers, as there is always a real number closer to 0. There is no longer an isolation between elements in the list.
There’s a lot that could be said about how we calculate probabilities of continuous sets, the difference between using sums and integrals for this calculation, or even the usefulness of the probability of a specific value in a continuous setting - but the conclusion remains that the one instance of 5 in an infinitely large set yields a probability of 0 for it being chosen at random. And the ones in distress by this comment can find solace in that, for this question of stars making triangles, we actually will not be pulling a discrete success set from a continuous set - we’ll be comparing the sizes of two infinitely large continuous sets.
*I believe this difference and many other aspects of this star claim that I will argue have clear explanation using aspects of a field of maths called Measure Theory, which I see as the math of set density. I don’t have any formal education or much personal research in this area, so for the more advanced than I, I would love to hear any connections that can be made between this claim we are investigating and measure theory. It’s a field that I’ve become more and more interested in learning about as I advance in my maths education.
Assumptions
Before we begin, we have to first construct some boundaries for our problem. To start, we will assume we are working with an infinitely large region of space to place stars in. The physicist among you would likely argue with this, as we believe the size of the universe is, at any given moment, of finite size. However we also believe the size of our universe is expanding without bound faster than the speed of light, so for this reason we will be taking this trend towards infinite space as an instantaneous reality.
For now to make visualization easier, we will be working with a 2-dimensional view of space rather than our usual 3 dimensions. Think of taking all of 3D space and projecting it onto the plane of which the triangle exists, the most natural seeming projection when dealing with this question. Think of this as “looking directly at the triangle” instead of “looking at the triangle from the side.” Don’t worry, we will later extend our argument into 3 dimensions.
Spatial Probabilities
If you’re confused on where we’ll even begin to calculate any probabilities of these kinds of geometric events, it takes a fun trick that is probably familiar. We will be comparing the sizes of areas where these outcomes can occur.
First think of a dartboard that lies perfectly within a square frame. Geometrically we would say that this dartboard is a circle inscribed in a square.
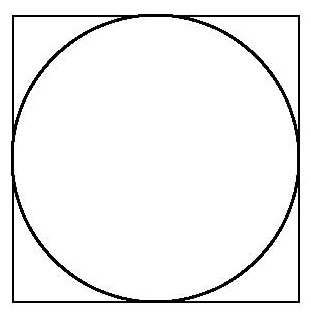
Notice that the radius of this circle is the same as one half of the square’s side lengths. Let’s call this \(r\).
Provided that all dart throws hit within the square frame, and each point within this frame is equally likely to be hit, what is the probability that a dart throw lands on the left half of the frame? It’s 50%, right? We divided the frame into two sections, left and right, and compared the size of our area of success to the size of the total area. Not too unlike how we picked 5 randomly from our discrete set before, except this time we are comparing the size of one continuous set to another.
Under these same assumptions, take a moment to ponder what the probability of throwing a dart and hitting the dart board would be. (Choosing a random point and having it be inside the circle)
It makes intuitive sense that, because each point on this square is equally likely to be hit by the dart, we can say that the overall probability of this occurring is the area of the circle divided by the area of the square. Here, the circle is acting as our set of successful outcomes and the square is acting as the set of all possible outcomes.
Area of circle = \(\pi r^{2}\)
Area of square = \(base \times height = 2r \times 2r = 4r^{2}\)
So the probability of hitting the dartboard = \(\frac{\pi r^{2}}{4r^2} = \frac{\pi}{4} \approx 0.7854\)
This should feel pretty good - looking at the diagram we see that the circle definitely takes up the majority of the space inside the square, but there is noticable area in the corners that lie outside of the circle. So we’d expect a probability of this happening to lie somewhere in the middle of \(0.50\) and \(1\).
Using this way of thinking we can start constructing some triangles.
Placing Stars
To make a triangle out of stars in the sky, we can say with confidence that we need three stars. Due to the infinite nature of the 2D space we are currently working with, we can assume WLOG that these two dots below represent the placement of our first two stars.
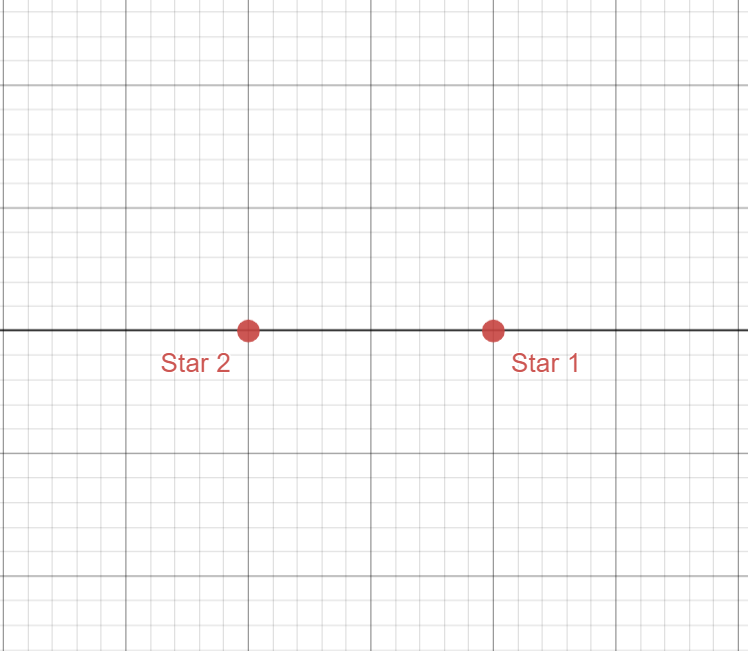
This assumption might have some of you scratching your heads. What if these stars aren’t placed there? What if the one on the right is moved up a little bit?
We have to remember that we’re working with an infinite plane here, and that we can slide and turn this plane and “zoom in and out” as much as we want. If the stars are placed closer together than in this image, we can “zoom in” our view so that we see the same thing as above. Similarly if the right star was moved up a little bit, we can rotate our view clockwise such that we see the same as the image. We call these transformations “translations, rotations, and dilations” and none of these will affect the angles within a triangle on the plane (when performed linearly).
However, we cannot shear the plane in order to achieve this orientation (I don’t think) - ponder briefly why we can’t do that.
So at this point we’ve placed two of the three stars randomly on the plane, and you might realize that the placement of the third will completely determine whether or not the triangle made by connecting the stars will be an acute triangle. It’s important to remember that we are dealing with an infinitely large plane here, so the boundaries of the image actually continue extending without bound.
I encourage you to try to think ahead through the next few steps ahead of time. Try picking any point on this plane and thinking of the type of triangle you create. Now drag this point around and notice how this triangle changes - specifically in what regions does the third star need to be in to create an acute triangle?
Look at this again, but with the following “critical boundaries” defined in black.
You’ll notice these colored regions actually show these areas where the triangle is acute and obtuse when the third star is placed in these regions. Any area in red marks where the triangle is obtuse (has an angle that is strictly greater than \(90^{\circ}\)) and any area in blue marks where the triangle is acute. The two upright black lines mark where the triangle is a right triangle (one angle is exactly \(90^{\circ}\)).
The right region in red marks where the “Star 1” angle is obtuse and the left region in red marks where the “Star 2” angle is obtuse. My favorite part about this diagram, however, is this circle in the middle. The red region inside this circle marks where the “Star 3” angle is obtuse, but I think a cooler realization comes from when the third star lies on this circle itself.
As a consequence of a simple geometric theorem we can see that, when the third star is located anywhere on this circle, using the stars as vertices yields a right triangle here as well. This portion is not relevant to answering our question, but it’s still a fun geometric side effect.
Finding the Probability
At this point we have everything we need to come up with a conclusion for the probability that randomly placing 3 stars on an infinite 2-dimensional night sky creates an acute triangle.
We know from before that this probability will come from comparing the area where this is successful (area in blue from previous diagram) to the total region of space. The problem with this is that they are both infinitely large. The entire plane extends infinitely in 2 dimensions and the blue strip in the middle where an acute triangle can be formed extends infinitely in 1 dimension - straight up and down.
That is exactly the key realization here. We can disregard the area of the small circle in the center as it is of finite area, so in the bigger picture of infinite areas, it trends towards having zero impact on the probability in question. Other than this we can see that the outside red areas grow without bounds in 2 dimensions while the blue strip inside grows without bounds in 1 dimension, so while there is an infinitely large area in blue, there is an infinitely larger infinitely large area in red in the plane.
This is one way to visualize this - zooming out of the diagram we have first highlights the fact that the area of that small circle becomes negligant very quickly, but secondly shows how this blue strip becomes infinitely thin compared to the red regions. Think back to our dart board example. In the previous animation we are looking at these regions still from a very zoomed in view of the diagram compared to the infinitely large space we are working with, and we can see that the probability of a dart landing within that strip is very unlikely compared to that of the red area, so as we zoom out to fit more and more of the space we are working with into frame, this probability becomes smaller and smaller.
This is a fine way of thinking about it, but I don’t think it fully causes most people to agree with our claim. It wouldn’t scratch the itch for me either, because we’re still comparing infinity to infinity here. Watching the next minute or so of this video will bring up another way to look at it.
Similar to how Dr. James Grime can compare cross-sectional areas of penny stacks to deduce information about the total volume of the stacks, we can look at “cross-sectional slices” of our graph to determine properties about how the total areas in our diagram relate to one another.
This animation really hammers home the realization of just how much larger the red regions are than the blue strip. At each instance, each “slice” of the diagram, we see that there is an infinitely long stretch of red extending to the left and to the right with a small section of blue with finite length. At each instance, the length of the blue sections are zero compared to the infinite length of the red sections, so we can conclude that, by adding up all of these “slices” of the diagram, the blue area is zero compared to the area denoted in red.
So what does this mean? It means that choosing a random point within this plane and having it end up in this blue strip has probability zero!
And that’s our conclusion! It is clearly possible to randomly place three random stars in a configuration that follows the blue strip, however there is a zero probability of this occurring when applying to an infinite plane.
Extending to Three Dimensions
There is a small subtlety to this problem when we talk about extending this conclusion to 3 dimensions. When we talk about acute triangles in three dimensions, it’s important to remember the definition of an acute triangle - every angle is less than \(90^{\circ}\). I’m emphasizing this to remove one’s frame of reference from the equation.
Create a circle with your thumb and first finger. Theoretically (if we had curved bones and could move our muscles in such a way), you would have a perfect circle in front of you right now. Now tilt your hand away from you slightly and notice what happens to this circle (again theoretically) - it begins to take on the shape of an oval rather than a perfect circle.
This is the reason I emphasize this definition, because changing one’s frame of reference when looking at a triangle in the sky could change their perception of the triangle’s classification. If you look at a right triangle “between” one of the legs you might see an acute triangle.
With this out of the way, there actually is not much more that needs considering when talking about this idea in 3 dimensions. In the same way as before, we can place the first two stars (WLOG) as seen below:
You can follow the same procedure we had before, or simply think about rotating our 2-dimensional diagram fully through the z-axis. Either way you’ll be coming up with the following picture:
In this new diagram we can see that the small circle has now become a sphere between the points, and the center strip indicating acute triangles is now a ring between the two “walls” extending infinitely in two dimensions, with the outside regions now extending unbounded in three dimensions as opposed to the previous two.
In the same way that we compared cross-sectional slices to determine properties of area like before, we can now use cross-sectional areas to determine relationships between volumes. This part I’ll leave up to you to discover! (Hint: The cross-sectional areas should look very familiar, especially the ones running through the origin)
This idea is one that I rarely talk to anyone about without them having some confusion, so hopefully I’ve explained my argument sufficiently here. If not, please do feel free to connect with me with any questions/explanations! There’s always the possibility that I’m wrong…